
| ☰ See All Chapters |
How to debug PHP in eclipse
In this tutorial you will learn to debug PHP in eclipse IDE. We use XAMPP package installed on windows operating system to run PHP. Refer the previous tutorial How to Install PHP on Windows to prepare environment to run PHP.
Step 1: Install Xdebug for XAMPP
If the file C:\xampp\php\ext\php_xdebug.dll already exists, you can skip the download, Otherwise download Xdebug for the specific PHP version:
1. PHP 7.4 (64-Bit): https://xdebug.org/files/php_xdebug-2.9.7-7.4-vc15-x86_64.dll
2. PHP 7.4 (32-Bit): https://xdebug.org/files/php_xdebug-2.9.7-7.4-vc15.dll
3. PHP 7.3 (64-Bit): https://xdebug.org/files/php_xdebug-2.9.7-7.3-vc15-x86_64.dll
4. PHP 7.3 (32-Bit): https://xdebug.org/files/php_xdebug-2.9.7-7.3-vc15.dll
5. PHP 7.2 (32-Bit): https://xdebug.org/files/php_xdebug-2.9.7-7.2-vc15.dll
6. PHP 7.1 (32-Bit): https://xdebug.org/files/php_xdebug-2.9.7-7.1-vc14.dll
7. PHP 7.0 (32-Bit): https://xdebug.org/files/php_xdebug-2.6.1-7.0-vc14.dll
Move the downloaded dll file to: C:\xampp\php\ext
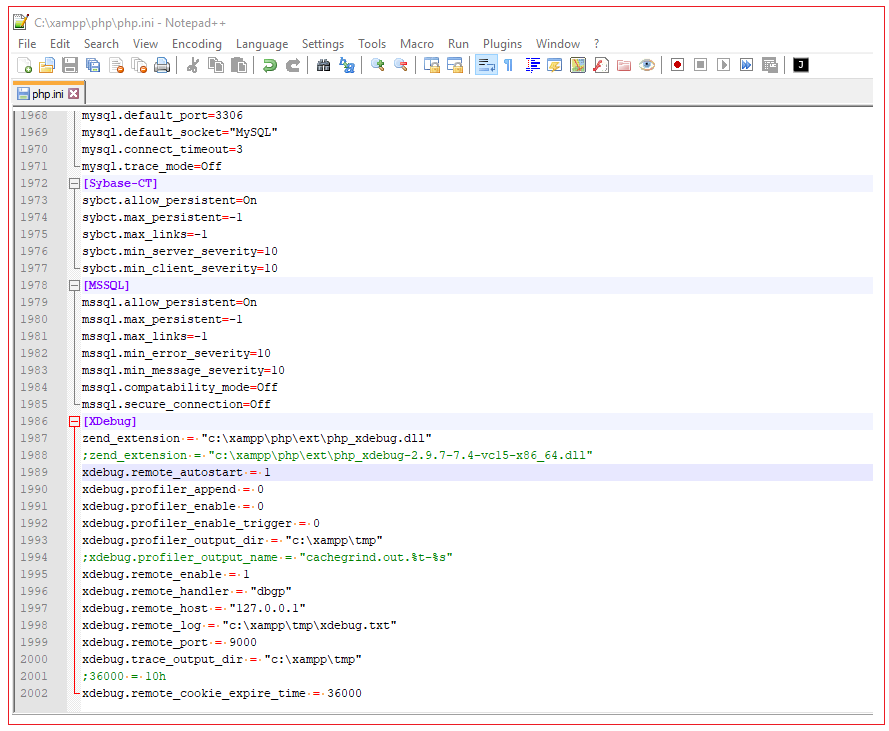
Open the file C:\xampp\php\php.ini with Notepad++
Disable output buffering: output_buffering = Off
Scroll down to the [XDebug] section (or create it) and copy/paste these lines:
[XDebug] zend_extension = "c:\xampp\php\ext\php_xdebug.dll" ;zend_extension = "c:\xampp\php\ext\php_xdebug-2.9.7-7.4-vc15-x86_64.dll" xdebug.remote_autostart = 1 xdebug.profiler_append = 0 xdebug.profiler_enable = 0 xdebug.profiler_enable_trigger = 0 xdebug.profiler_output_dir = "c:\xampp\tmp" ;xdebug.profiler_output_name = "cachegrind.out.%t-%s" xdebug.remote_enable = 1 xdebug.remote_handler = "dbgp" xdebug.remote_host = "127.0.0.1" xdebug.remote_log = "c:\xampp\tmp\xdebug.txt" xdebug.remote_port = 9000 xdebug.trace_output_dir = "c:\xampp\tmp" ;36000 = 10h xdebug.remote_cookie_expire_time = 36000 |
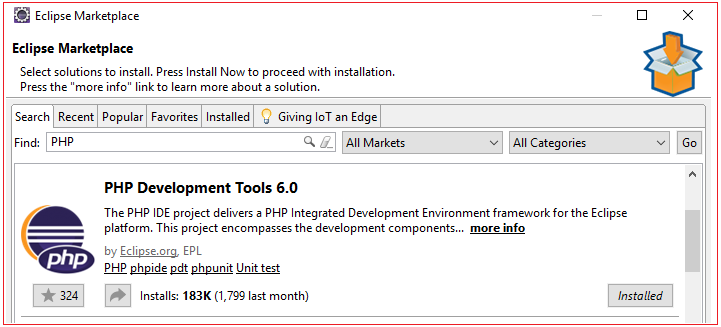
Step 2: Install PHP Development Tools plugin
Install PHP Development Tools Plugin form eclipse marketplace. From eclipse navigate to Help then click on Eclipse Market Place. Now search for PHP. You will get the PHP Development Tools Plugin in search results. Click on Install button to install the plugin.
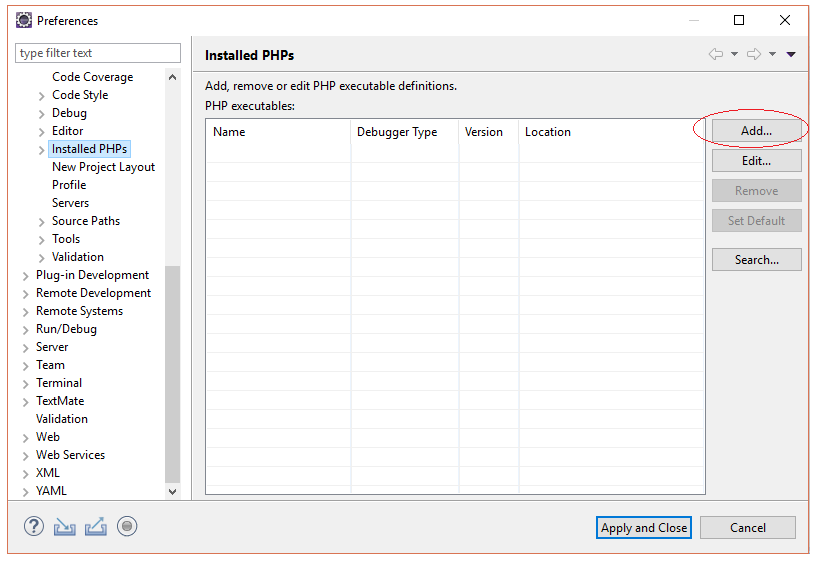
Step 3: Configure PHP executable
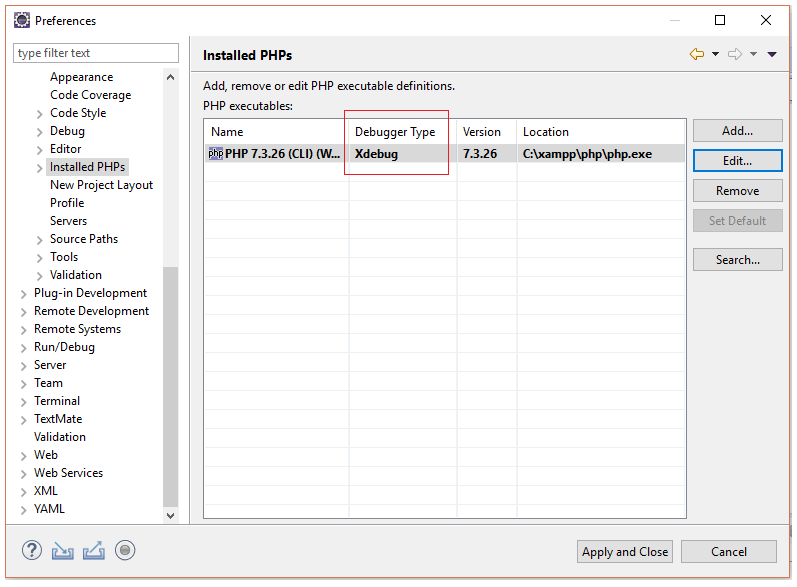
Select Windows>Preferences>PHP>Installed PHPs, then click on Add Button.
Click on Browse button and select the PHP executable php.exe from XAMPP installation. Click on Finish button.
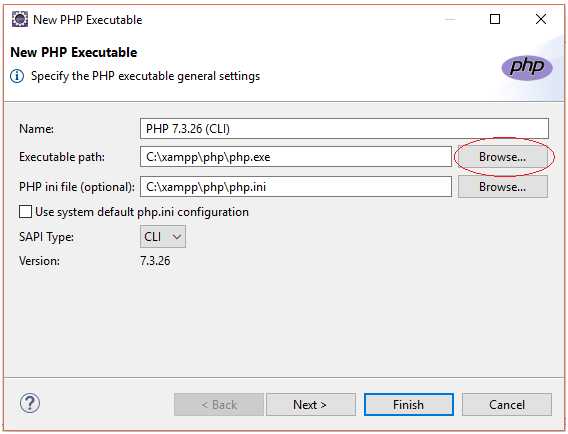
After you click on Finish Button, you can see the added PHP executable and debugger Type. Now you click on Apply And Close.
Step 4: Create PHP project
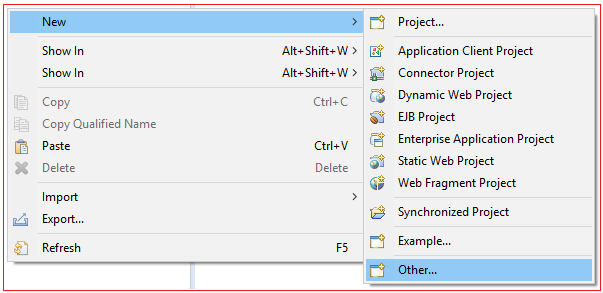
Select New>Other
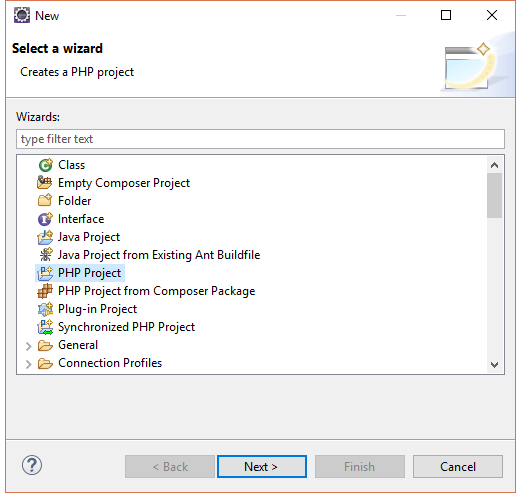
Select PHP Project and Click Next
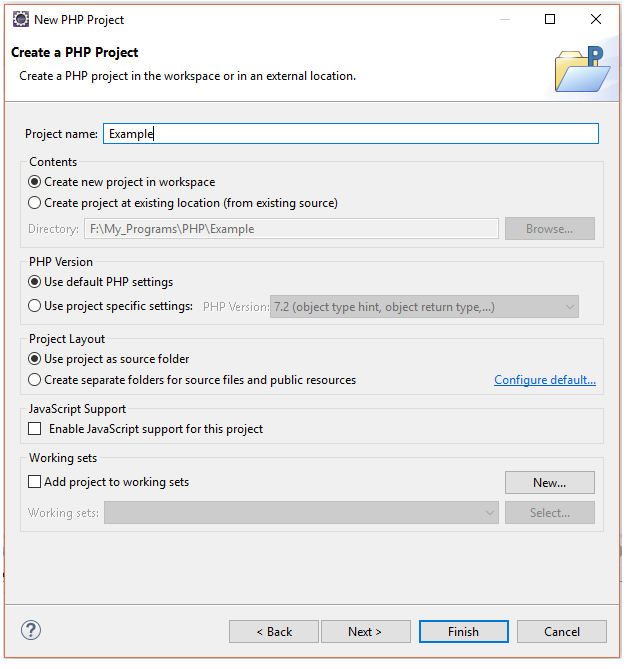
Enter the project name and click Finish
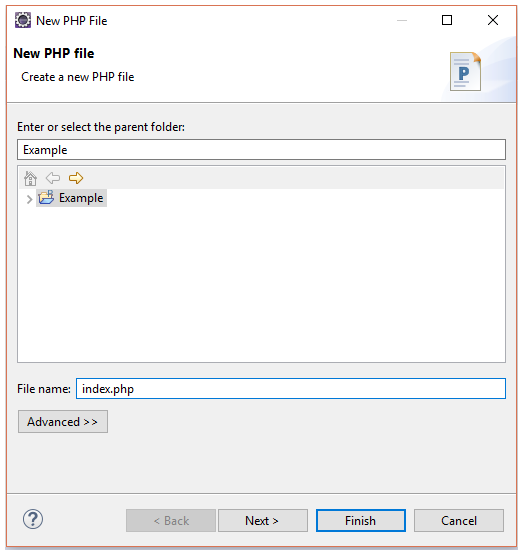
Step 5: Create PHP File
Right click on project and select New>PHP File.
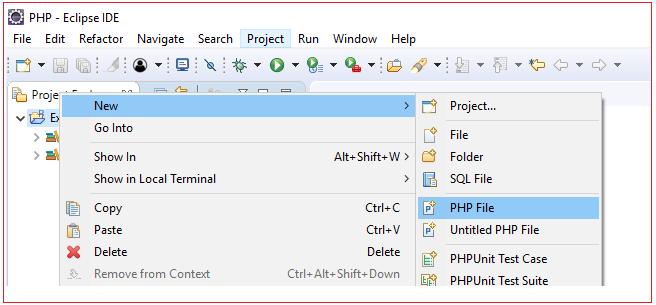
Enter the name and click Finish
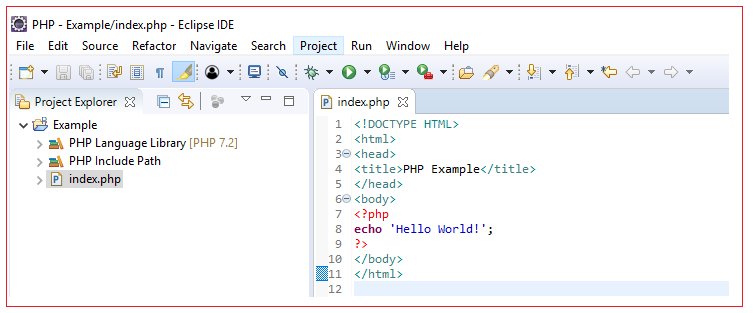
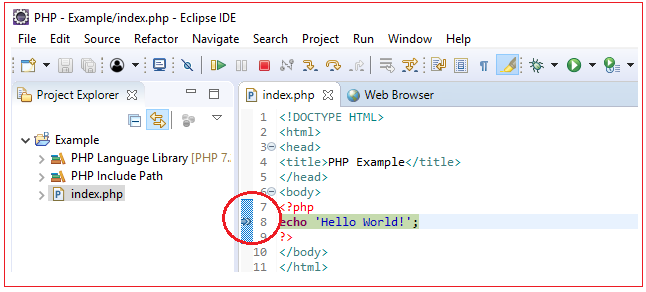
Enter the below code to the php file
<!DOCTYPE HTML> <html> <head> <title>PHP Example</title> </head> <body> <?php echo 'Hello World!'; ?> </body> </html> |
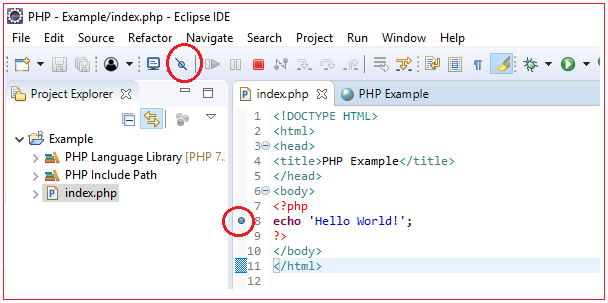
Step 6: Check the debugger working
Add some debugger point on PHP file and make sure debugger is enabled.
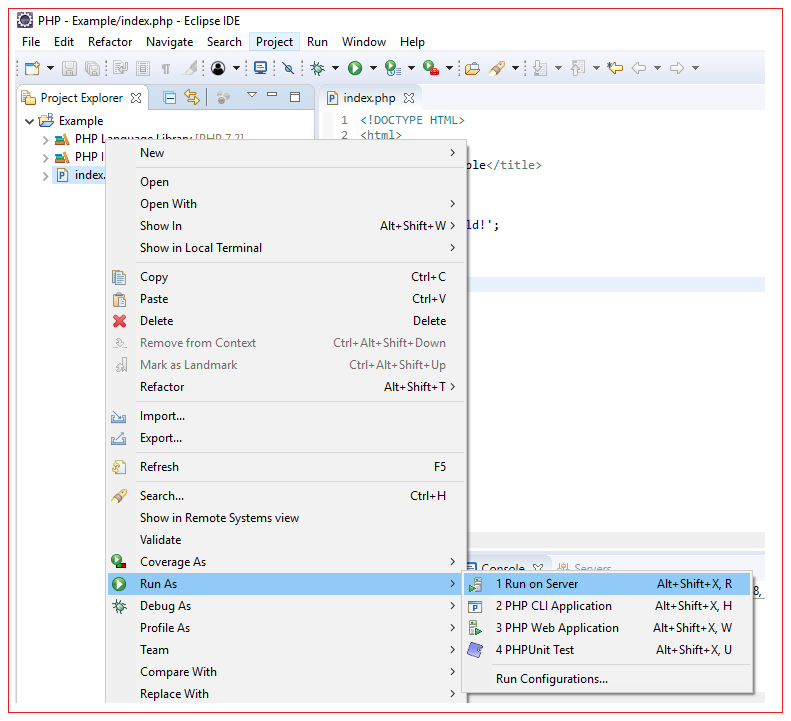
Right click on index.php, select Run As>Run on Server.
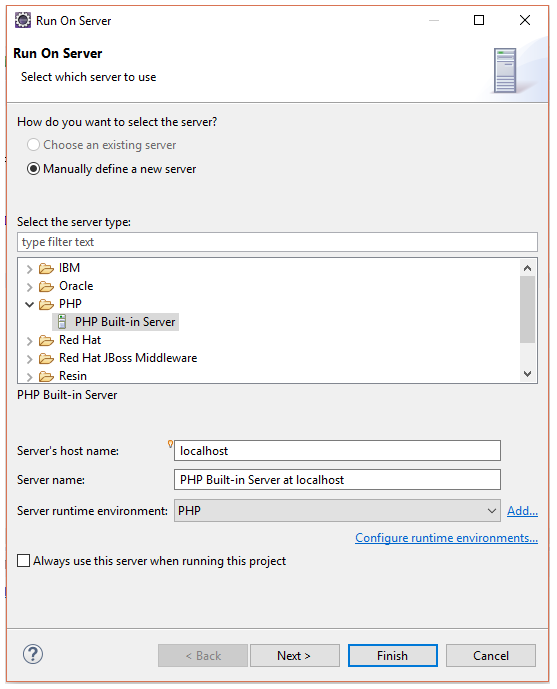
Select PHP Built-in Server and click Finish
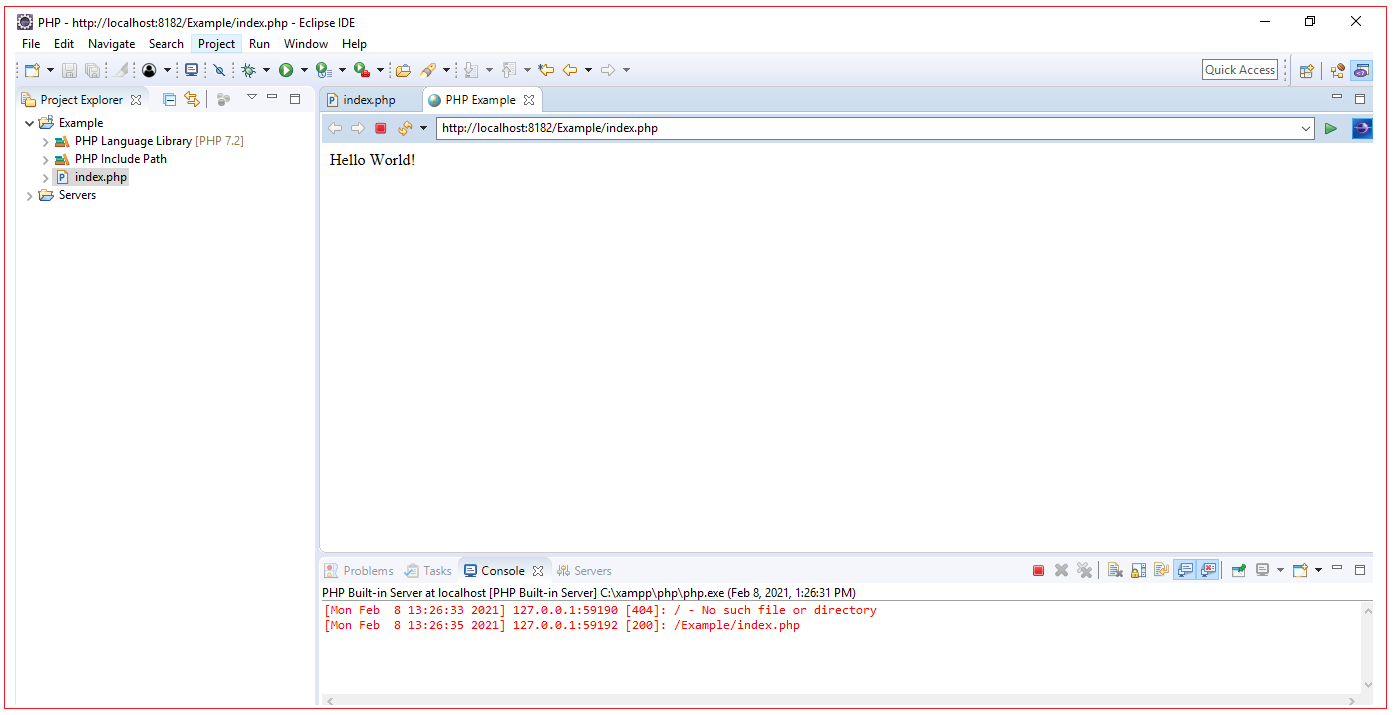
Now you should see the debugger stopped at enabled debugger point.
Once debugging is complete, you should see the output now as below:
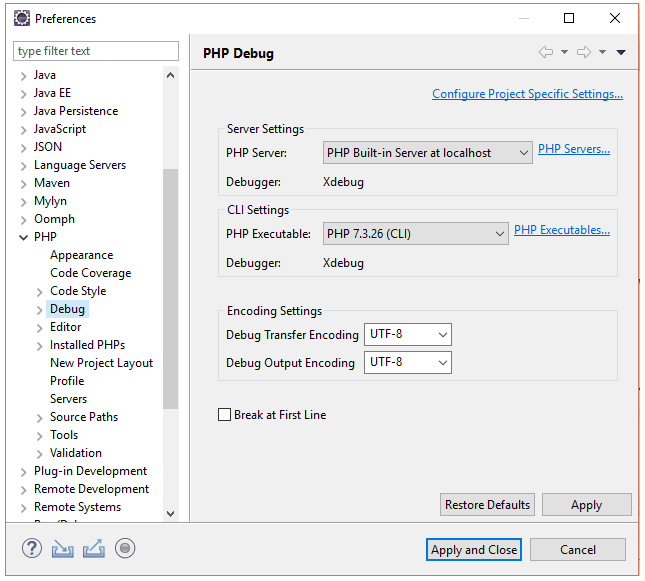
Step 7: Configure Debugger.
Select Windows>Preferences>PHP>Debug, Make sure you have made configuration as below. Unselect the checkbox “Break at First Line” otherwise debugger stops at first line. We need to stop debugger at enabled debugger points. Now you restart eclipse, sometime changes will not get apply immediately until restart.
All Chapters
